Market Outlook
November 24, 2016
Market Cues
Domestic Indices
Chg (%)
(Pts)
(Close)
Indian market is expected to open on a negative note tracking the SGX Nifty.
BSE Sensex
0.4
91
26,052
The US markets made new record closing highs at the end of Wednesday’s session
Nifty
0.4
31
8,033
on low trading volumes. A US Commerce Department report showed a sharp uptick
Mid Cap
1.2
145
12,042
in durable goods orders for the month of October. Durable goods orders increased
Small Cap
1.5
179
11,806
by 4.8 percent in October, after rising by 0.4 percent in September. This was against
Bankex
0.0
10
21,247
expectations of an increase of 1.5 percent compared to a 0.3 percent drop in
September.
Global Indices
Chg (%)
(Pts)
(Close)
The FTSE closed slightly negative on Wednesday as lower crude oil prices kept
Dow Jones
0.3
59
19,083
energy stocks subdued. Stocks also reacted negatively to the Chancellor of the
Exchequer statement that the growth of the UK economy is likely to slow drastically
Nasdaq
(0.1)
(6)
5,381
next year. The UK government has cut its growth forecast for next year from 2.2 to
FTSE
(0.0)
(2)
6,818
1.4 percent.
Nikkei
0.3
57
18,163
Indian stocks continued from their rally from Tuesday, as value buying kept prices
Hang Seng
(0.0)
(1)
22,677
firm during the trading session. Metal and pharma indices were the major gainers
Shanghai Com
(0.2)
(7)
3,241
for the session. Both indices were up by 2.56 and 2.25 percent respectively. Metal
stocks were supported by stronger global commodity prices. Lupin was the biggest
Advances / Declines
BSE
NSE
gainer on the Sensex. It closed up 5.2 percent on news that it had gained tentative
approval for a drug used in HIV treatment.
Advances
1,920
1,259
Declines
681
358
News Analysis
Unchanged
171
57
Tata Steel to setup 55,000 tonne plant in Odisha
Reliance group to sell TV and radio assets to Zee
Volumes (` Cr)
Detailed analysis on Pg2
BSE
2,499
Investor’s Ready Reckoner
NSE
18,594
Key Domestic & Global Indicators
Stock Watch: Latest investment recommendations on 150+ stocks
Net Inflows (` Cr)
Net
Mtd
Ytd
Refer Pg5 onwards
FII
(675)
(11,762)
33,252
MFs
920
8,024
30,077
Top Picks
CMP
Target
Upside
Company
Sector
Rating
(`)
(`)
(%)
Top Gainers
Price (`)
Chg (%)
Amara Raja BatteriesAuto & Auto Ancill.
Buy
940
1,167
24.2
Pel
1,656
10.6
HCL Tech
IT
Buy
763
1,000
31.1
Ibrealest
69
10.1
Asian Granito
Capital Goods
Buy
187
351
88.2
Equitas Holdings
Financials
Buy
153
235
53.5
Bergepaint
199
7.6
Navkar Corporation Others
Buy
176
265
50.6
Intellect
131
7.2
More Top Picks on Pg3
Jklakshmi
372
7.1
Key Upcoming Events
Previous
Consensus
Date
Region
Event Description
Top Losers
Price (`)
Chg (%)
Reading
Expectations
Aloktext
2
(7.2)
Nov 24 Germany GDP nsa (YoY)
1.5
1.5
Nov 25 US
GDP QoQ (Annualised)
2.9
3.1
Balkrisind
924
(4.2)
Nov 29 UK
GDP (YoY)
2.3
2.3
Finolexind
403
(3.8)
Nov 29 Euro Zone Euro Zone Consumer Confidence
(6.1)
--
Denabank
34
(3.6)
Nov 29 US
Consumer Confidence
98.6
100.0
Naukri
931
(3.0)
More Events on Pg4
As on November 23, 2016
Market Outlook
November 24, 2016
News Analysis
Tata Steel to setup 55,000 tonne plant in Odisha
Tata Steel is ready to commission a 55,000 tonne per annum ferrochrome plant at
Gopalpur in south Odisha on November
30th. Though the work on the
ferrochrome plant had been completed, its commissioning was delayed due to
local agitation and power connection issues. The plant was built at a cost of
`542cr.
Besides Gopalpur, Tata Steel has two other ferrochrome plants in Odisha, one at
Bamnipal of 65,000 tonnes and the other at Athgarh of 55,000 tonnes.
Reliance group to sell TV and radio assets to Zee
Anil Ambani’s Reliance Group said that it will sell a 49% stake in its radio business
and its entire TV business to Zee Group entities to help reduce debt.
Reliance Broadcast Network Ltd (RBNL), part of the Anil Ambani group, has signed
agreements with Zee Media Corp. to sell its stake in its radio broadcast business.
Zee Entertainment Enterprises Ltd will acquire Reliance’s general entertainment TV
business.
The transactions will help reduce debt by about `1,900cr ($283 million), the
company said in a statement. The transactions are expected to be completed by
next year.
RBNL runs a network of FM Radio channels in India under the brand name of 92.7
Big FM that reaches 45 cities, 1,200 towns and over 200 mln people. The general
entertainment TV broadcasting business currently comprises two channels—Big
Magic and Big Ganga. Big Magic is a comedy channel catering to Hindi-speaking
markets while Big Ganga is a Bhojpuri entertainment channel catering to people in
Bihar, Jharkhand and eastern Uttar Pradesh.
Economic and Political News
SEBI relaxes funding rules for Angel funds in startups as minimum they can
invest increased from `50 lakh to `25 lakh
Cabinet approves introduction of Merchant Shipping Bill 2016 in the
Parliament
Government of India and ISRO sign MoU/ bilateral agreements with 39
foreign countries on peaceful use of outer space
Corporate News
TVS Motors launches app IRIDE to enhance riding experience of consumers
Former Chairman FC Kohli denies allegations that Ratan Tata proposed sale
of TCS to IBM
Suzlon Energy generates `238cr profit on higher revenues and improved
margins
Market Outlook
November 24, 2016
Top Picks ★★★★★
Large Cap
Market Cap
CMP
Target
Upside
Company
Rationale
(` Cr)
(`)
(`)
(%)
To outpace battery industry growth due to better technological
Amara Raja Batteries
16,050
940
1,167
24.2
products leading to market share gains in both the
automotive OEM and replacement segments.
The stock is trading at attractive valuations and is factoring all
HCL Tech
1,07,605
763
1,000
31.1
the bad news.
Back on the growth trend; expect a long term growth of 14%
Infosys
2,11,434
921
1,249
35.7
to be a US$20bn in FY2020.
Source: Company, Angel Research
Mid Cap
Market Cap
CMP
Target
Upside
Company
Rationale
(` Cr)
(`)
(`)
(%)
We expect the company would report strong profitability
Asian Granito
561
187
351
88.2
owing to better product mix, higher B2C sales and
amalgamation synergy.
Among the top 4 players in the consumer durables segment.
Bajaj Electricals
2,203
218
274
25.5
Improved profitability backed by turn around in E&P segment.
Strong order book lends earnings visibility.
Favourable outlook for the AC industry to augur well for
Cooling products business which is out pacing the market
Blue Star
4,476
469
634
35.1
growth. EMPPAC division's profitability to improve once
operating environment turns around.
With a focus on the low and medium income (LMI) consumer
Dewan Housing Finance
7,265
232
350
50.8
segment, the company has increased its presence in tier-II &
III cities where the growth opportunity is immense.
Strong loan growth backed by diversified loan portfolio and
Equitas Holdings
5,133
153
235
53.5
adequate CAR. ROE & ROA likely to remain decent as risk of
dilution remains low. Attractive valuations considering growth.
Economic recovery to have favourable impact on advertising
& circulation revenue growth. Further, the acquisition of a
Jagran Prakashan
5,613
172
225
31.0
radio business (Radio City) would also boost the company's
revenue growth.
Speedier execution and speedier sales, strong revenue visibilty
Mahindra Lifespace
1,457
355
522
47.0
in short-to-long run, attractive valuations
We expect the company to report strong growth on back of
healthy growth in domestic branded sales (owing to
Mirza International
845
70
107
52.3
aggressive ad spend and addition in the number of EBOs &
multi-brand outlets [MBOs]) and healthy export revenues.
Massive capacity expansion along with rail advantage at ICD
Navkar Corporation
2,510
176
265
50.6
as well CFS augurs well for the company.
Strong brands and distribution network would boost growth
Siyaram Silk Mills
1,113
1,187
1,714
44.4
going ahead. Stock currently trades at an inexpensive
valuation.
Market leadership in Hindi news genre and no. 2 viewership
ranking in English news genre, exit from the radio business,
TV Today Network
1,879
315
385
22.2
and anticipated growth in ad spends by corporate to benefit
the stock.
Source: Company, Angel Research
Market Outlook
November 24, 2016
Key Upcoming Events
Global economic events release calendar
Date
Time
Country
Event Description
Unit
Period
Bloomberg Data
Last Reported Estimated
Nov 24, 2016 12:30PM
Germany
GDP nsa (YoY)
% Change
3Q F
1.50
1.50
Nov 25, 2016 7:00PM
US
GDP Qoq (Annualised)
% Change
3Q S
2.90
3.10
Nov 29, 2016 3:00PM
UK
GDP (YoY)
% Change
3Q P
2.30
2.30
3:30PM
Euro Zone
Euro-Zone Consumer Confidence
Value
Nov F
(6.10)
--
8:30PM
US
Consumer Confidence
S.A./ 1985=100
Nov
98.60
100.00
Nov 30, 2016 2:25PM
Germany
Unemployment change (000's)
Thousands
Nov
(13.00)
--
Dec 1, 2016
3:00PM
UK
PMI Manufacturing
Value
Nov
54.30
--
6:30AM
China
PMI Manufacturing
Value
Nov
51.20
51.00
Dec 2, 2016
7:00PM
US
Change in Nonfarm payrolls
Thousands
Nov
161.00
173.00
7:00PM
US
Unnemployment rate
%
Nov
4.90
4.90
Dec 6, 2016
3:30PM
Euro Zone
Euro-Zone GDP s.a. (QoQ)
% Change
3Q F
0.30
--
Dec 7, 2016
3:00PM
UK
Industrial Production (YoY)
% Change
Oct
0.30
--
2:30PM
India
RBI Reverse Repo rate
%
Dec 7
5.75
--
2:30PM
India
RBI Cash Reserve ratio
%
Dec 7
4.00
--
2:30PM
India
RBI Repo rate
%
Dec 7
6.25
--
Dec 8, 2016
China
Exports YoY%
% Change
Nov
(7.30)
--
6:15PM
Euro Zone
ECB announces interest rates
%
Dec 8
--
--
Dec 9, 2016
India
Imports YoY%
% Change
Nov
8.10
--
India
Exports YoY%
% Change
Nov
9.59
--
7:00AM
China
Consumer Price Index (YoY)
% Change
Nov
2.10
--
Dec 12, 2016 5:30PM
India
Industrial Production YoY
% Change
Oct
0.70
--
Dec 13, 2016 3:00PM
UK
CPI (YoY)
% Change
Nov
0.90
--
7:30AM
China
Industrial Production (YoY)
% Change
Nov
6.10
--
Dec 14, 2016 7:45PM
US
Industrial Production
%
Nov
0.04
--
US
Producer Price Index (mom)
% Change
Nov
0.40
--
12:00PM
India
Monthly Wholesale Prices YoY%
% Change
Nov
3.39
--
3:00PM
UK
Jobless claims change
% Change
Nov
9.80
--
Dec 15, 2016 7:00PM
US
Consumer price index (mom)
% Change
Nov
0.40
--
5:30PM
UK
BOE Announces rates
% Ratio
Dec 15
0.25
--
12:30AM
US
FOMC rate decision
%
Dec 14
0.50
0.75
Source: Bloomberg, Angel Research
Market Outlook
November 24, 2016
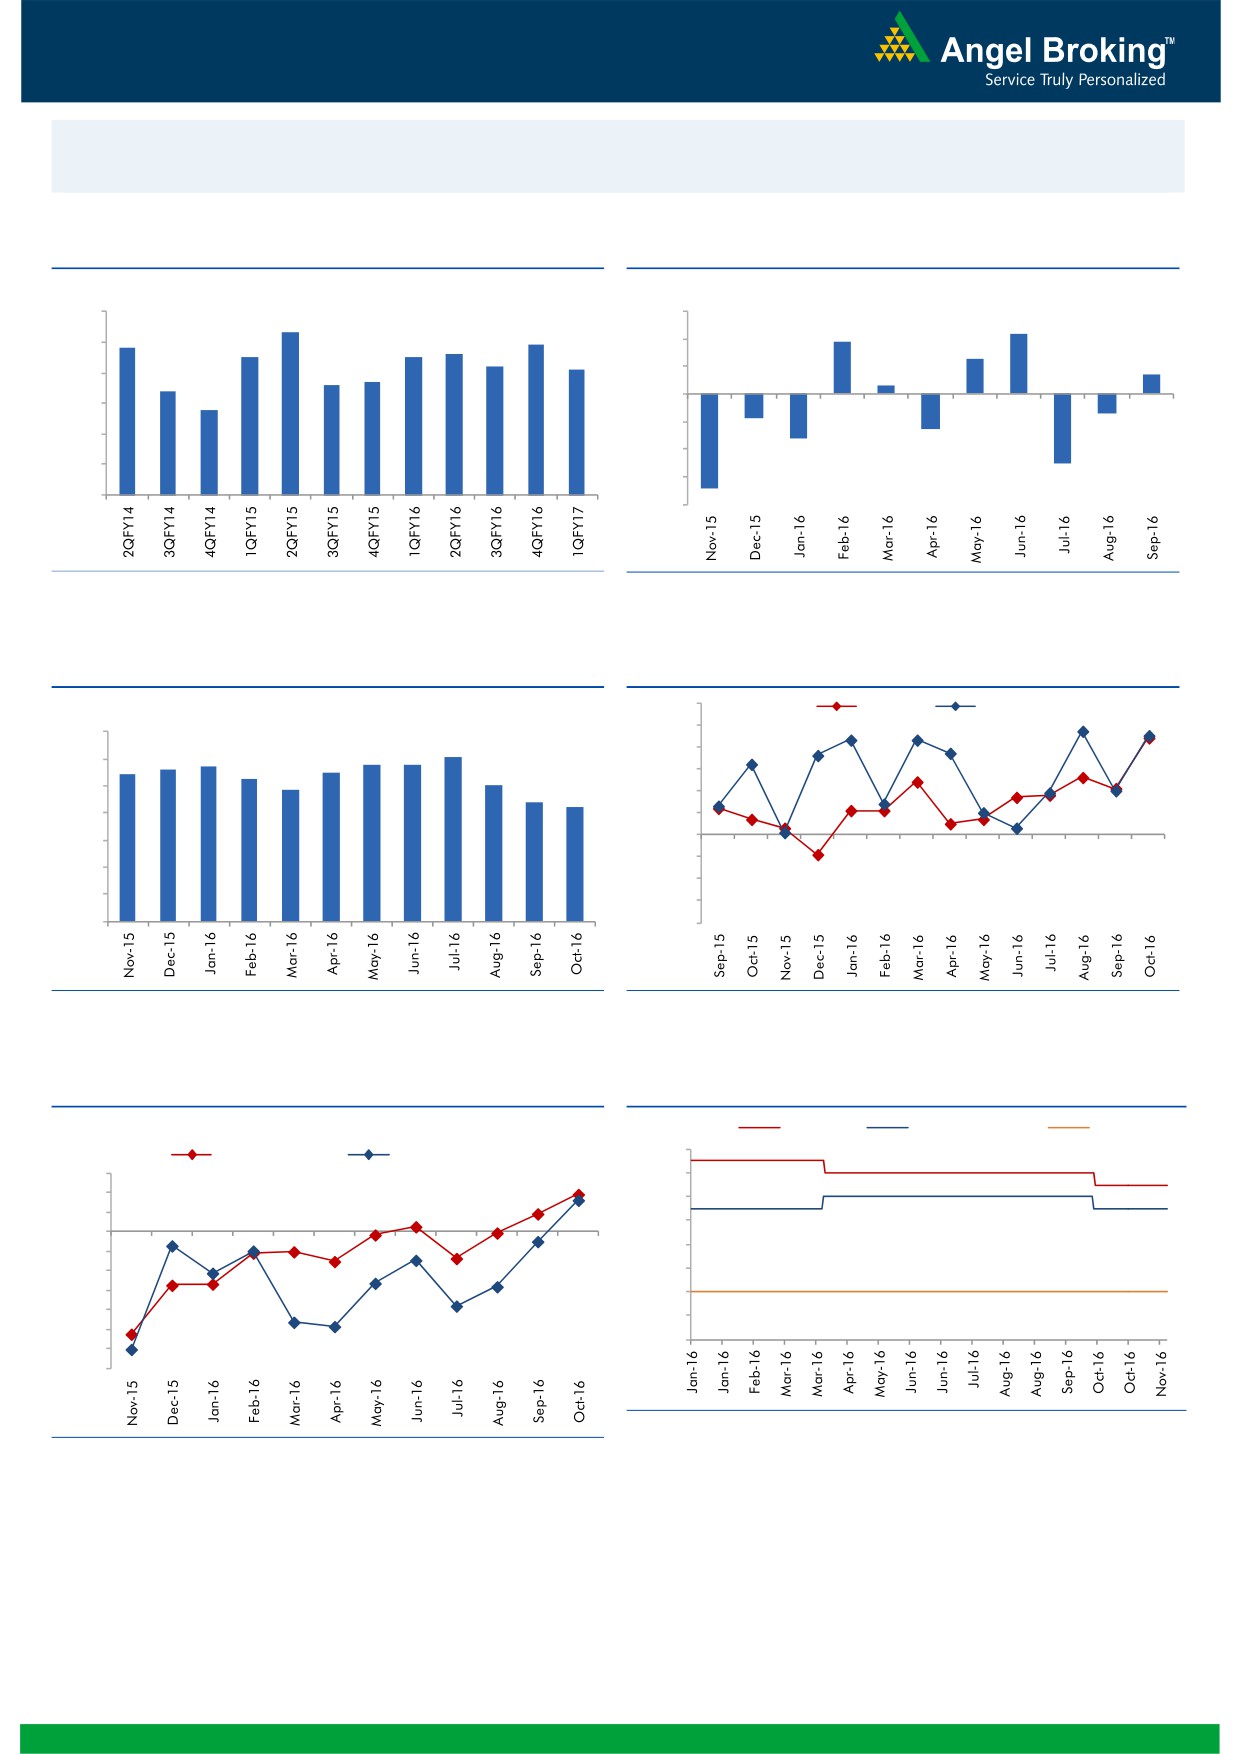
Macro watch
Exhibit 1: Quarterly GDP trends
Exhibit 2: IIP trends
(%)
(%)
9.0
3.0
8.3
2.2
7.9
1.9
7.8
8.0
7.5
7.5
7.6
2.0
1.3
7.2
7.1
0.7
6.6
6.7
1.0
0.3
7.0
6.4
5.8
-
6.0
(1.0)
5.0
(0.7)
(0.9)
(2.0)
(1.3)
(1.6)
4.0
(3.0)
(2.5)
3.0
(4.0)
(3.4)
Source: CSO, Angel Research
Source: MOSPI, Angel Research
Exhibit 3: Monthly CPI inflation trends
Exhibit 4: Manufacturing and services PMI
56.0
Mfg. PMI
Services PMI
(%)
55.0
7.0
6.1
5.7
5.8
5.8
54.0
6.0
5.4
5.6
5.5
5.3
5.1
53.0
4.8
5.0
4.4
4.2
52.0
4.0
51.0
3.0
50.0
49.0
2.0
48.0
1.0
47.0
-
46.0
Source: MOSPI, Angel Research
Source: Market, Angel Research; Note: Level above 50 indicates expansion
Exhibit 5: Exports and imports growth trends
Exhibit 6: Key policy rates
c
(%)
Repo rate
Reverse Repo rate
CRR
7.00
(%)
Exports yoy growth
Imports yoy growth
15.0
6.50
10.0
6.00
5.0
5.50
0.0
5.00
(5.0)
(10.0)
4.50
(15.0)
4.00
(20.0)
3.50
(25.0)
3.00
(30.0)
(35.0)
Source: RBI, Angel Research
Source: Bloomberg, Angel Research
Market Outlook
November 24, 2016
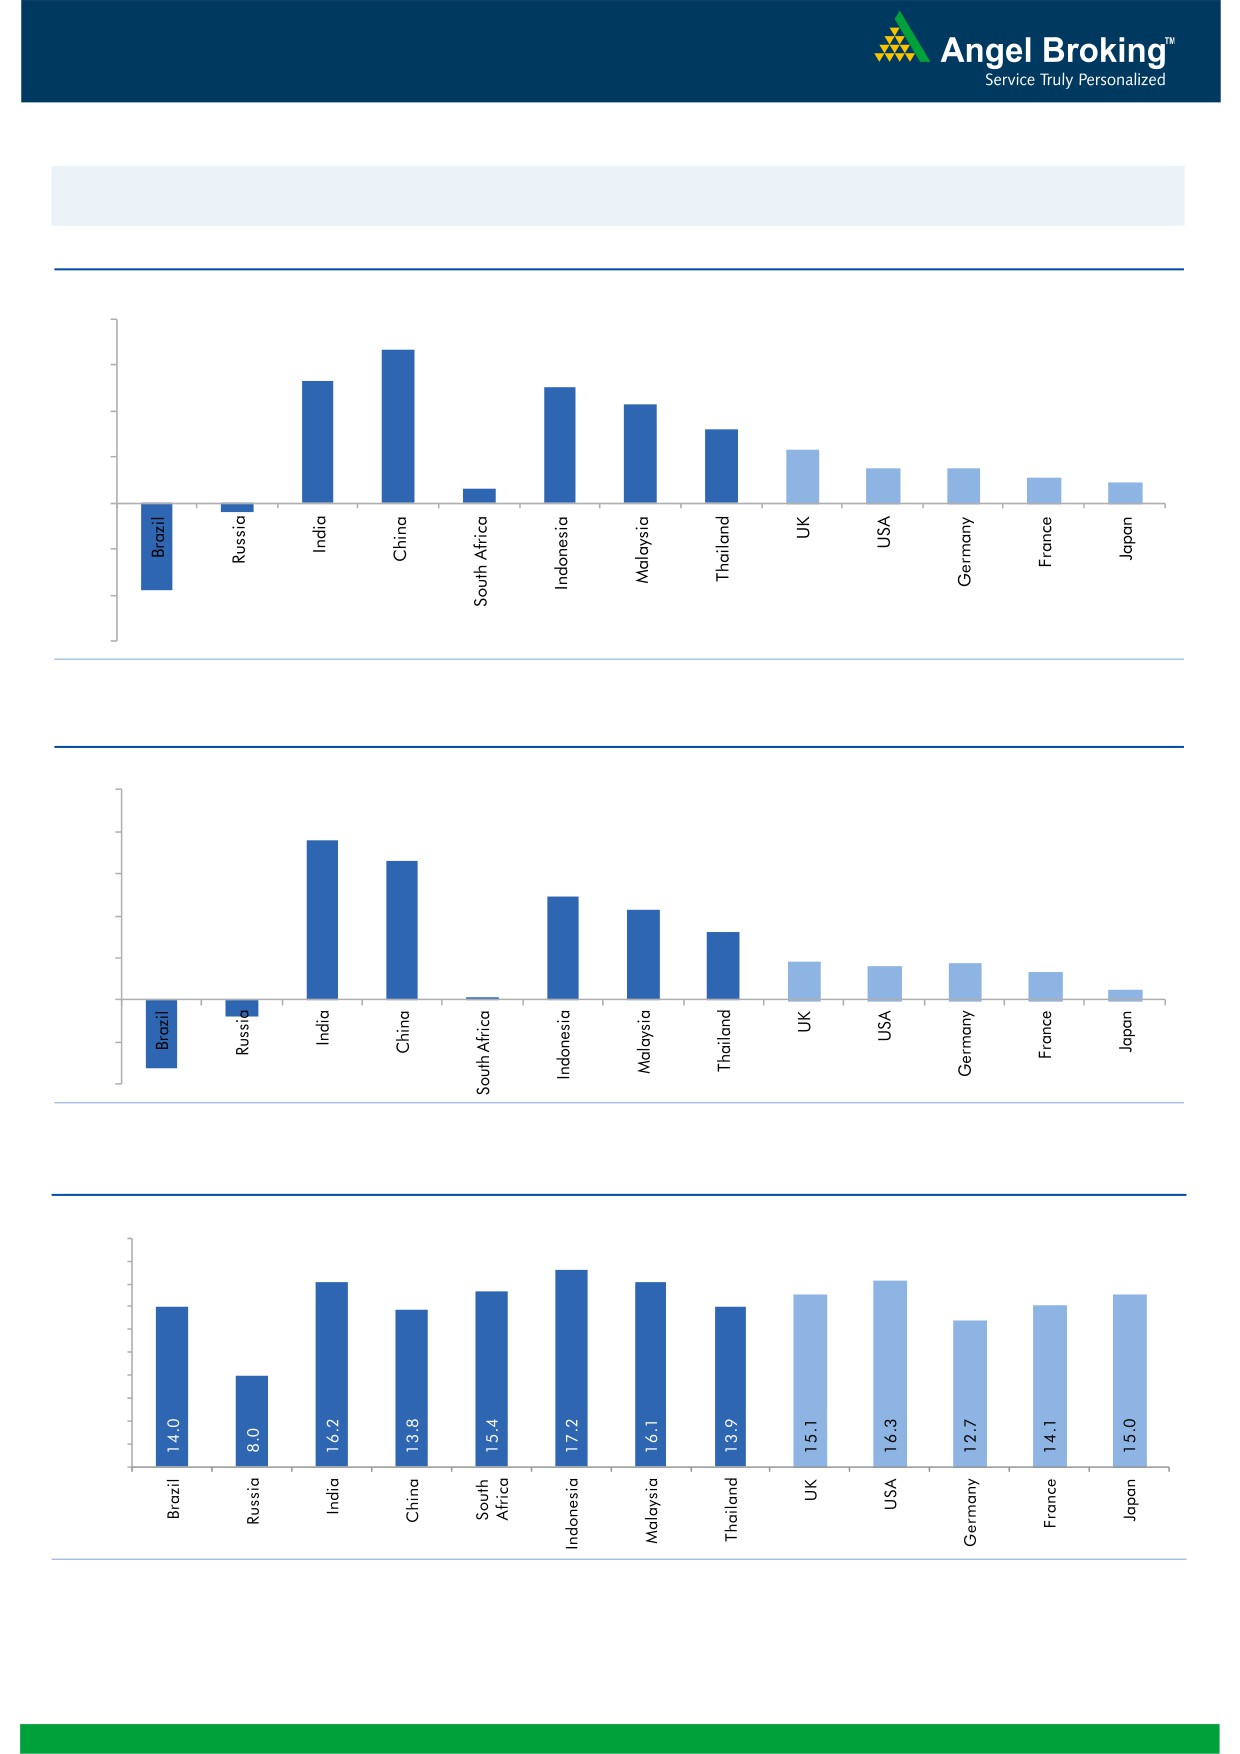
Global watch
Exhibit 1: Latest quarterly GDP Growth (%, yoy) across select developing and developed countries
(%)
8.0
6.7
6.0
5.3
0.6
5.0
4.3
4.0
3.2
2.3
1.5
1.5
2.0
1.1
0.9
-
(2.0)
(0.4)
(4.0)
(3.8)
(6.0)
Source: Bloomberg, Angel Research
Exhibit 2: 2016 GDP Growth projection by IMF (%, yoy) across select developing and developed countries
(%)
10.0
7.6
8.0
6.6
6.0
4.9
4.3
4.0
3.2
1.8
1.7
1.6
1.3
2.0
(0.8)
0.5
(3.3)
0.1
-
(2.0)
(4.0)
Source: IMF, Angel Research
Exhibit 3: One year forward P-E ratio across select developing and developed countries
(x)
20.0
18.0
16.0
14.0
12.0
10.0
8.0
6.0
4.0
2.0
-
Source: IMF, Angel Research
Market Outlook
November 24, 2016
Exhibit 4: Relative performance of indices across globe
Returns (%)
Country
Name of index
Closing price
1M
3M
1YR
Brazil
Bovespa
61,986
(2.9)
4.9
31.2
Russia
Micex
2,086
6.5
5.2
11.7
India
Nifty
8,033
(7.6)
(7.4)
2.9
China
Shanghai Composite
3,241
3.4
4.1
(10.2)
South Africa
Top 40
44,077
(2.3)
(5.7)
(6.1)
Mexico
Mexbol
45,184
(6.4)
(6.4)
2.4
Indonesia
LQ45
873
(6.5)
(8.1)
14.3
Malaysia
KLCI
1,630
(2.8)
(3.4)
(1.9)
Thailand
SET 50
933
(1.5)
(5.4)
4.9
USA
Dow Jones
19,083
4.7
3.3
7.1
UK
FTSE
6,818
(2.4)
(0.3)
6.6
Japan
Nikkei
18,163
5.4
10.2
(7.8)
Germany
DAX
10,662
(0.9)
0.4
(5.8)
France
CAC
4,529
(0.5)
2.8
(7.7)
Source: Bloomberg, Angel Research
Stock Watch
November 24, 2016
Company Name
Reco
CMP
Target
Mkt Cap
Sales ( Čcr )
OPM(%)
EPS (Č)
PER(x)
P/BV(x)
RoE(%)
EV/Sales(x)
(Č)
Price ( Č)
( Č cr )
FY17E FY18E
FY17E
FY18E
FY17E
FY18E
FY17E
FY18E
FY17E
FY18E
FY17E
FY18E
FY17E
FY18E
Agri / Agri Chemical
Rallis
Accumulate
189
209
3,670
1,937
2,164
13.3
14.3
9.0
11.0
21.0
17.2
3.7
3.2
18.4
19.8
1.9
1.7
United Phosphorus
Accumulate
611
684
30,965
15,176
17,604
18.5
18.5
37.4
44.6
16.3
13.7
3.2
2.7
21.4
21.2
2.2
1.8
Auto & Auto Ancillary
Ashok Leyland
Buy
77
111
21,984
22,407
26,022
10.6
10.6
5.2
6.4
14.8
12.0
3.4
2.8
23.6
24.7
1.1
0.9
Bajaj Auto
Neutral
2,596
-
75,112
25,093
27,891
19.5
19.2
143.9
162.5
18.0
16.0
5.1
4.4
30.3
29.4
2.7
2.4
Bharat Forge
Neutral
898
-
20,903
7,726
8,713
20.5
21.2
35.3
42.7
25.4
21.0
4.7
4.2
18.9
20.1
2.8
2.4
Eicher Motors
Neutral
20,960
-
56,931
16,583
20,447
17.5
18.0
598.0
745.2
35.1
28.1
12.0
9.1
41.2
38.3
3.3
2.6
Gabriel India
Buy
108
130
1,558
1,544
1,715
9.0
9.3
5.4
6.3
20.1
17.2
3.8
3.4
18.9
19.5
1.0
0.9
Hero Motocorp
Buy
3,013
3,541
60,163
30,958
34,139
15.7
15.7
193.6
208.3
15.6
14.5
6.1
5.0
34.2
30.5
1.8
1.6
Jamna Auto Industries Neutral
178
-
1,425
1,486
1,620
9.8
9.9
15.0
17.2
11.9
10.4
2.6
2.2
21.8
21.3
1.0
0.9
L G Balakrishnan & Bros Neutral
590
-
926
1,302
1,432
11.6
11.9
43.7
53.0
13.5
11.1
1.9
1.7
13.8
14.2
0.8
0.7
Mahindra and Mahindra Neutral
1,193
-
74,112
46,534
53,077
11.6
11.7
67.3
78.1
17.7
15.3
2.9
2.5
15.4
15.8
1.6
1.3
Maruti
Buy
4,882
6,006
147,462
68,057
82,958
15.8
15.5
212.1
261.2
23.0
18.7
4.6
3.8
19.8
20.3
1.9
1.4
Minda Industries
Neutral
292
-
2,312
2,728
3,042
9.0
9.1
68.2
86.2
4.3
3.4
1.0
0.8
23.8
24.3
0.9
0.8
Motherson Sumi
Neutral
297
-
41,660
45,896
53,687
7.8
8.3
13.0
16.1
22.8
18.4
7.3
5.9
34.7
35.4
1.0
0.8
Rane Brake Lining
Neutral
923
-
731
511
562
11.3
11.5
28.1
30.9
32.9
29.9
5.0
4.6
15.3
15.0
1.6
1.4
Setco Automotive
Neutral
37
-
490
741
837
13.0
13.0
15.2
17.0
2.4
2.2
0.4
0.4
15.8
16.3
1.0
1.0
Tata Motors
Neutral
471
-
136,103
300,209
338,549
8.9
8.4
42.7
54.3
11.1
8.7
1.8
1.5
15.6
17.2
0.6
0.5
TVS Motor
Neutral
354
-
16,830
13,390
15,948
6.9
7.1
12.8
16.5
27.8
21.4
6.9
5.5
26.3
27.2
1.3
1.1
Amara Raja Batteries
Buy
940
1,167
16,050
5,504
6,605
18.4
19.8
33.4
40.9
28.1
23.0
6.2
5.0
22.1
22.0
2.9
2.4
Exide Industries
Neutral
175
-
14,845
7,439
8,307
15.0
15.0
8.1
9.3
21.6
18.8
3.0
2.7
14.3
16.7
1.6
1.4
Apollo Tyres
Buy
178
235
9,076
12,877
14,504
14.3
13.9
21.4
23.0
8.3
7.8
1.3
1.1
16.4
15.2
0.9
0.8
Ceat
Buy
1,148
1,450
4,645
7,524
8,624
13.0
12.7
131.1
144.3
8.8
8.0
1.6
1.4
19.8
18.6
0.7
0.6
JK Tyres
Neutral
113
-
2,561
7,455
8,056
15.0
15.0
21.8
24.5
5.2
4.6
1.1
0.9
22.8
21.3
0.5
0.4
Swaraj Engines
Neutral
1,313
-
1,631
660
810
15.2
16.4
54.5
72.8
24.1
18.0
7.5
6.8
31.5
39.2
2.3
1.8
Subros
Neutral
164
-
983
1,488
1,681
11.7
11.9
6.4
7.2
25.6
22.9
2.7
2.5
10.8
11.4
0.9
0.8
Indag Rubber
Neutral
176
-
463
286
326
19.8
16.8
11.7
13.3
15.1
13.2
2.5
2.4
17.8
17.1
1.3
1.1
Capital Goods
ACE
Neutral
45
-
444
709
814
4.1
4.6
1.4
2.1
32.0
21.4
1.3
1.3
4.4
6.0
0.8
0.7
BEML
Neutral
786
-
3,272
3,451
4,055
6.3
9.2
31.4
57.9
25.0
13.6
1.5
1.4
6.3
10.9
1.1
0.9
Bharat Electronics
Accumulate
1,294
1,414
28,905
8,137
9,169
16.8
17.2
58.7
62.5
22.1
20.7
3.4
3.0
44.6
46.3
2.5
2.3
Stock Watch
November 24, 2016
Company Name
Reco
CMP
Target
Mkt Cap
Sales ( Čcr )
OPM(%)
EPS (Č)
PER(x)
P/BV(x)
RoE(%)
EV/Sales(x)
(Č)
Price ( Č)
( Č cr )
FY17E
FY18E
FY17E
FY18E
FY17E
FY18E
FY17E
FY18E
FY17E
FY18E
FY17E
FY18E
FY17E
FY18E
Capital Goods
Voltas
Buy
299
407
9,893
6,511
7,514
7.9
8.7
12.9
16.3
23.2
18.3
4.2
3.7
16.7
18.5
1.3
1.1
BGR Energy
Neutral
108
-
779
16,567
33,848
6.0
5.6
7.8
5.9
13.8
18.3
0.8
0.8
4.7
4.2
0.1
0.1
BHEL
Neutral
125
-
30,607
28,797
34,742
-
2.8
2.3
6.9
54.4
18.1
0.9
0.9
1.3
4.8
0.7
0.5
Blue Star
Buy
469
634
4,476
4,283
5,077
5.9
7.3
14.9
22.1
31.5
21.2
6.1
5.2
20.4
26.4
1.1
0.9
Crompton Greaves
Neutral
73
-
4,572
5,777
6,120
5.9
7.0
3.3
4.5
22.1
16.2
1.0
0.9
4.4
5.9
0.7
0.6
Greaves Cotton
Neutral
124
-
3,020
1,755
1,881
16.8
16.9
7.8
8.5
15.9
14.6
3.2
2.9
20.6
20.9
1.4
1.3
Inox Wind
Neutral
178
-
3,960
5,605
6,267
15.7
16.4
24.8
30.0
7.2
6.0
2.0
1.5
25.9
24.4
0.7
0.6
KEC International
Neutral
135
-
3,464
9,294
10,186
7.9
8.1
9.9
11.9
13.6
11.3
2.0
1.7
15.6
16.3
0.6
0.5
Thermax
Neutral
838
-
9,979
5,421
5,940
7.3
7.3
25.7
30.2
32.6
27.7
3.9
3.6
12.2
13.1
1.7
1.6
VATech Wabag
Buy
478
681
2,606
3,136
3,845
8.9
9.1
26.0
35.9
18.4
13.3
2.3
2.0
13.4
15.9
0.7
0.6
Cement
ACC
Neutral
1,303
-
24,466
11,225
13,172
13.2
16.9
44.5
75.5
29.3
17.3
2.8
2.6
11.2
14.2
2.2
1.9
Ambuja Cements
Neutral
198
-
39,375
9,350
10,979
18.2
22.5
5.8
9.5
34.2
20.9
2.9
2.6
10.2
12.5
4.2
3.6
India Cements
Neutral
114
-
3,513
4,364
4,997
18.5
19.2
7.9
11.3
14.5
10.1
1.0
1.0
8.0
8.5
1.6
1.4
JK Cement
Neutral
678
-
4,740
4,398
5,173
15.5
17.5
31.2
55.5
21.7
12.2
2.6
2.3
12.0
15.5
1.6
1.3
J K Lakshmi Cement
Buy
372
565
4,373
2,913
3,412
14.5
19.5
7.5
22.5
49.6
16.5
3.1
2.6
12.5
18.0
2.1
1.7
Orient Cement
Buy
130
215
2,667
2,114
2,558
18.5
20.5
8.1
11.3
16.1
11.5
2.4
2.0
9.0
14.0
1.9
1.5
UltraTech Cement
Neutral
3,451
-
94,717
25,768
30,385
21.0
23.5
111.0
160.0
31.1
21.6
4.0
3.5
13.5
15.8
3.8
3.1
Construction
ITNL
Neutral
90
-
2,974
8,946
10,017
31.0
31.6
8.1
9.1
11.2
9.9
0.4
0.4
4.2
5.0
3.7
3.4
KNR Constructions
Accumulate
718
802
2,020
1,385
1,673
14.7
14.0
41.2
48.5
17.4
14.8
3.3
2.8
14.9
15.2
1.5
1.3
Larsen & Toubro
Buy
1,358
1,700
126,553
67,665
77,249
10.7
11.5
57.3
71.2
23.7
19.1
2.2
2.0
12.6
14.3
2.1
1.8
Gujarat Pipavav Port
Neutral
140
-
6,785
705
788
52.2
51.7
5.0
5.6
28.1
25.1
2.8
2.5
11.2
11.2
9.3
7.8
Nagarjuna Const.
Neutral
75
-
4,158
8,842
9,775
9.1
8.8
5.3
6.4
14.1
11.7
1.1
1.0
8.2
9.1
0.6
0.5
PNC Infratech
Buy
114
143
2,936
2,350
2,904
13.1
13.2
9.0
8.8
12.7
13.0
0.5
0.4
15.9
13.9
1.4
1.1
Simplex Infra
Neutral
295
-
1,461
6,829
7,954
10.5
10.5
31.4
37.4
9.4
7.9
1.0
0.9
9.9
13.4
0.6
0.5
Power Mech Projects
Neutral
451
-
663
1,801
2,219
12.7
14.6
72.1
113.9
6.3
4.0
1.2
1.0
16.8
11.9
0.4
0.3
Sadbhav Engineering
Accumulate
282
298
4,830
3,598
4,140
10.3
10.6
9.0
11.9
31.3
23.7
3.3
2.9
9.9
11.9
1.6
1.4
NBCC
Neutral
229
-
13,719
7,428
9,549
7.9
8.6
8.2
11.0
27.9
20.8
1.4
1.1
28.2
28.7
1.6
1.2
MEP Infra
Neutral
36
-
582
1,877
1,943
30.6
29.8
3.0
4.2
11.9
8.5
5.8
3.9
0.6
0.6
1.7
1.5
SIPL
Neutral
85
-
2,989
1,036
1,252
65.5
66.2
(8.4)
(5.6)
3.2
3.6
(22.8)
(15.9)
11.1
9.2
Stock Watch
November 24, 2016
Company Name
Reco
CMP
Target
Mkt Cap
Sales ( Čcr )
OPM(%)
EPS (Č)
PER(x)
P/BV(x)
RoE(%)
EV/Sales(x)
(Č)
Price ( Č)
( Č cr )
FY17E
FY18E
FY17E
FY18E
FY17E
FY18E
FY17E
FY18E
FY17E
FY18E
FY17E
FY18E
FY17E
FY18E
Construction
Engineers India
Neutral
276
-
9,315
1,725
1,935
16.0
19.1
11.4
13.9
24.3
19.9
3.3
3.2
13.4
15.3
4.3
3.9
Financials
Axis Bank
Buy
480
630
114,672
46,932
53,575
3.5
3.4
32.4
44.6
14.9
10.8
1.9
1.7
13.6
16.5
-
-
Bank of Baroda
Neutral
162
-
37,420
19,980
23,178
1.8
1.8
11.5
17.3
14.1
9.4
1.6
1.3
8.3
10.1
-
-
Canara Bank
Neutral
304
-
16,529
15,225
16,836
1.8
1.8
14.5
28.0
21.0
10.9
1.5
1.2
5.8
8.5
-
-
Dewan Housing Finance Buy
232
350
7,265
2,225
2,688
2.9
2.9
29.7
34.6
7.8
6.7
1.3
1.1
16.1
16.8
-
-
Equitas Holdings
Buy
153
235
5,133
939
1,281
11.7
11.5
5.8
8.2
26.4
18.7
2.3
2.0
10.9
11.5
-
-
Federal Bank
Neutral
70
-
11,967
9,353
10,623
2.9
2.9
4.4
5.8
15.8
12.0
1.5
1.3
9.5
11.0
-
-
HDFC
Neutral
1,226
-
193,818
11,475
13,450
3.4
3.4
45.3
52.5
27.1
23.4
5.2
4.6
20.2
20.5
-
-
HDFC Bank
Accumulate
1,185
1,350
299,986
46,097
55,433
4.5
4.5
58.4
68.0
20.3
17.4
3.6
3.0
18.8
18.6
-
-
ICICI Bank
Buy
265
315
154,208
42,800
44,686
3.1
3.3
18.0
21.9
14.7
12.1
2.0
1.9
11.1
12.3
-
-
LIC Housing Finance
Buy
526
630
26,535
3,712
4,293
2.6
2.5
39.0
46.0
13.5
11.4
2.5
2.2
19.9
20.1
-
-
Punjab Natl.Bank
Neutral
138
-
29,270
23,532
23,595
2.3
2.4
6.8
12.6
20.2
10.9
3.1
2.2
3.3
6.5
-
-
RBL Bank
Neutral
341
-
12,599
1,783
2,309
2.6
2.6
12.7
16.4
26.8
20.8
2.9
2.6
12.8
13.3
-
-
South Ind.Bank
Neutral
21
-
2,775
6,435
7,578
2.5
2.5
2.7
3.1
7.6
6.6
1.0
0.8
10.1
11.2
-
-
St Bk of India
Neutral
259
-
200,862
88,650
98,335
2.6
2.6
13.5
18.8
19.2
13.8
1.8
1.6
7.0
8.5
-
-
Union Bank
Neutral
149
-
10,253
13,450
14,925
2.3
2.3
25.5
34.5
5.9
4.3
0.9
0.7
7.5
10.2
-
-
Yes Bank
Neutral
1,126
-
47,392
8,978
11,281
3.3
3.4
74.0
90.0
15.2
12.5
2.9
2.5
17.0
17.2
-
-
FMCG
Asian Paints
Neutral
943
-
90,404
17,128
18,978
16.8
16.4
19.1
20.7
49.4
45.5
17.2
16.2
34.8
35.5
5.2
4.7
Britannia
Buy
2,963
3,626
35,550
9,594
11,011
14.6
14.9
80.3
94.0
36.9
31.5
15.2
11.7
41.2
-
3.6
3.1
Colgate
Accumulate
922
995
25,089
4,605
5,149
23.4
23.4
23.8
26.9
38.8
34.3
21.5
16.8
64.8
66.8
5.4
4.8
Dabur India
Accumulate
281
304
49,362
8,315
9,405
19.8
20.7
8.1
9.2
34.6
30.5
9.6
8.0
31.6
31.0
5.6
4.9
GlaxoSmith Con*
Neutral
5,157
-
21,690
4,350
4,823
21.2
21.4
179.2
196.5
28.8
26.3
7.6
6.5
27.1
26.8
4.4
3.9
Godrej Consumer
Neutral
1,423
-
48,441
10,235
11,428
18.4
18.6
41.1
44.2
34.6
32.2
7.7
6.5
24.9
24.8
4.8
4.3
HUL
Neutral
831
-
179,741
35,252
38,495
17.8
17.8
20.7
22.4
40.2
37.1
38.4
33.0
95.6
88.9
4.9
4.5
ITC
Buy
225
284
271,050
40,059
44,439
38.3
39.2
9.0
10.1
25.0
22.2
7.0
6.1
27.8
27.5
6.3
5.6
Marico
Buy
255
300
32,938
6,430
7,349
18.8
19.5
6.4
7.7
39.9
33.2
12.0
10.1
33.2
32.5
4.9
4.3
Nestle*
Neutral
5,963
-
57,491
10,073
11,807
20.7
21.5
124.8
154.2
47.8
38.7
19.6
17.6
34.8
36.7
5.5
4.7
Tata Global
Neutral
118
-
7,425
8,675
9,088
9.8
9.8
7.4
8.2
15.9
14.4
1.8
1.7
7.9
8.1
0.8
0.7
Procter & Gamble
Accumulate
6,550
7,369
21,262
2,939
3,342
23.2
23.0
146.2
163.7
44.8
40.0
100.3
96.2
25.3
23.5
6.8
5.9
Hygiene
Stock Watch
November 24, 2016
Company Name
Reco
CMP
Target
Mkt Cap
Sales ( Čcr )
OPM(%)
EPS (Č)
PER(x)
P/BV(x)
RoE(%)
EV/Sales(x)
(Č)
Price ( Č)
( Č cr )
FY17E FY18E
FY17E
FY18E
FY17E
FY18E
FY17E
FY18E
FY17E
FY18E
FY17E
FY18E
FY17E
FY18E
IT
HCL Tech^
Buy
763
1,000
107,605
49,242
57,168
20.5
20.5
55.7
64.1
13.7
11.9
2.8
2.1
20.3
17.9
2.0
1.7
Infosys
Buy
921
1,249
211,434
68,350
77,326
27.0
27.0
62.5
69.4
14.7
13.3
3.1
2.9
21.3
21.6
2.5
2.2
TCS
Buy
2,157
2,620
424,962
119,025
133,308
27.6
27.6
131.2
145.5
16.4
14.8
5.3
4.9
32.4
33.1
3.3
2.9
Tech Mahindra
Buy
452
600
43,842
29,673
32,937
15.5
17.0
32.8
39.9
13.8
11.3
2.7
2.3
19.6
20.7
1.2
1.0
Wipro
Buy
448
590
108,933
55,440
60,430
18.1
18.1
35.9
39.9
12.5
11.2
2.2
2.1
19.0
19.3
1.7
1.5
Media
D B Corp
Neutral
367
-
6,751
2,297
2,590
27.4
28.2
21.0
23.4
17.5
15.7
4.1
3.5
23.7
23.1
2.7
2.4
HT Media
Neutral
71
-
1,661
2,693
2,991
12.6
12.9
7.9
9.0
9.0
7.9
0.8
0.7
7.8
8.3
0.2
0.1
Jagran Prakashan
Buy
172
225
5,613
2,355
2,635
28.0
28.0
10.8
12.5
15.9
13.7
3.5
3.0
21.7
21.7
2.4
2.1
Sun TV Network
Neutral
447
-
17,621
2,850
3,265
70.1
71.0
26.2
30.4
17.1
14.7
4.4
3.9
24.3
25.6
5.8
4.9
Hindustan Media
Neutral
273
-
2,004
1,016
1,138
24.3
25.2
27.3
30.1
10.0
9.1
1.9
1.7
16.2
15.8
1.3
1.1
Ventures
TV Today Network
Buy
315
385
1,879
637
743
27.5
27.5
18.4
21.4
17.1
14.7
3.0
2.5
17.4
17.2
2.6
2.1
Metals & Mining
Coal India
Neutral
304
-
191,891
84,638
94,297
21.4
22.3
24.5
27.1
12.4
11.2
5.2
4.9
42.6
46.0
1.8
1.6
Hind. Zinc
Neutral
258
-
108,950
14,252
18,465
55.9
48.3
15.8
21.5
16.3
12.0
2.7
2.3
17.0
20.7
7.6
5.9
Hindalco
Neutral
174
-
35,828
107,899
112,095
7.4
8.2
9.2
13.0
18.9
13.4
0.9
0.9
4.8
6.6
0.9
0.8
JSW Steel
Neutral
1,651
-
39,902
53,201
58,779
16.1
16.2
130.6
153.7
12.6
10.7
1.7
1.5
14.0
14.4
1.5
1.3
NMDC
Neutral
115
-
36,416
6,643
7,284
44.4
47.7
7.1
7.7
16.2
15.0
1.4
1.4
8.8
9.2
3.3
2.9
SAIL
Neutral
49
-
20,134
47,528
53,738
(0.7)
2.1
(1.9)
2.6
18.8
0.5
0.5
(1.6)
3.9
1.3
1.2
Vedanta
Neutral
217
-
64,275
71,744
81,944
19.2
21.7
13.4
20.1
16.2
10.8
1.4
1.2
8.4
11.3
1.3
1.0
Tata Steel
Neutral
392
-
38,106
121,374
121,856
7.2
8.4
18.6
34.3
21.1
11.4
1.3
1.2
6.1
10.1
1.0
0.9
Oil & Gas
Cairn India
Neutral
241
-
45,175
9,127
10,632
4.3
20.6
8.8
11.7
27.4
20.6
0.9
0.9
3.3
4.2
6.4
5.3
GAIL
Neutral
412
-
52,299
56,220
65,198
9.3
10.1
27.1
33.3
15.2
12.4
1.4
1.3
9.3
10.7
1.1
0.9
ONGC
Neutral
279
-
239,040
137,222
152,563
15.0
21.8
19.5
24.1
14.3
11.6
1.2
1.2
8.5
10.1
2.0
1.8
Indian Oil Corp
Neutral
298
-
144,900
373,359
428,656
5.9
5.5
54.0
59.3
5.5
5.0
0.9
0.8
16.0
15.6
0.5
0.5
Reliance Industries
Neutral
1,007
-
326,595
301,963
358,039
12.1
12.6
87.7
101.7
11.5
9.9
1.2
1.1
10.7
11.3
1.6
1.3
Pharmaceuticals
Alembic Pharma
Neutral
644
-
12,149
3,483
4,083
20.2
21.4
24.3
30.4
26.5
21.2
6.0
4.8
25.5
25.3
3.4
2.8
Aurobindo Pharma
Buy
731
877
42,788
15,720
18,078
23.7
23.7
41.4
47.3
17.7
15.5
4.6
3.6
29.6
26.1
2.9
2.6
Sanofi India*
Neutral
4,260
-
9,811
2,277
2,597
17.3
18.3
149.4
172.0
28.5
24.8
4.7
3.8
25.1
28.8
4.0
3.2
Cadila Healthcare
Neutral
392
-
40,136
10,429
12,318
22.6
22.0
16.9
19.2
23.2
20.4
5.9
4.7
28.5
25.7
3.8
3.2
Cipla
Reduce
552
490
44,373
15,378
18,089
17.4
18.4
21.6
27.2
25.6
20.3
3.3
2.9
13.7
15.2
3.1
2.6
Stock Watch
November 24, 2016
Company Name
Reco
CMP
Target
Mkt Cap
Sales ( Čcr )
OPM(%)
EPS (Č)
PER(x)
P/BV(x)
RoE(%)
EV/Sales(x)
(Č)
Price ( Č)
( Č cr )
FY17E FY18E
FY17E
FY18E
FY17E
FY18E
FY17E
FY18E
FY17E
FY18E
FY17E
FY18E
FY17E
FY18E
Pharmaceuticals
Dr Reddy's
Neutral
3,128
-
51,826
16,043
18,119
20.8
22.4
112.4
142.9
27.8
21.9
3.7
3.3
14.1
15.9
3.2
2.8
Dishman Pharma
Neutral
243
-
3,923
1,718
1,890
22.7
22.8
9.5
11.3
25.6
21.5
2.5
2.2
10.1
10.9
2.7
2.4
GSK Pharma*
Neutral
2,647
-
22,420
3,000
3,312
15.4
20.6
46.5
60.8
56.9
43.5
13.7
13.6
26.3
30.6
7.2
6.6
Indoco Remedies
Reduce
279
240
2,574
1,112
1,289
16.2
18.2
11.6
16.0
24.1
17.5
3.9
3.2
17.0
20.1
2.4
2.0
Ipca labs
Accumulate
560
613
7,064
3,303
3,799
15.3
15.3
17.3
19.7
32.4
28.4
2.8
2.6
9.1
9.4
2.3
2.0
Lupin
Buy
1,487
1,809
67,053
15,912
18,644
26.4
26.7
58.1
69.3
25.6
21.5
5.0
4.1
21.4
20.9
4.3
3.5
Sun Pharma
Buy
701
847
168,721
31,129
35,258
32.0
32.9
30.2
35.3
23.2
19.9
3.8
3.1
20.0
20.1
5.0
4.2
Power
Tata Power
Neutral
69
-
18,743
36,916
39,557
17.4
27.1
5.1
6.3
13.6
11.0
1.2
1.1
9.0
10.3
1.5
1.4
NTPC
Neutral
160
-
131,886
86,605
95,545
17.5
20.8
11.8
13.4
13.6
11.9
1.4
1.3
10.5
11.1
2.9
2.9
Power Grid
Neutral
182
-
95,136
25,763
29,762
74.3
73.1
14.8
17.3
12.3
10.5
1.9
1.7
16.9
17.5
8.0
7.6
Real Estate
MLIFE
Buy
355
522
1,457
1,152
1,300
22.7
24.6
29.9
35.8
11.9
9.9
0.9
0.8
7.6
8.6
2.0
1.6
Telecom
Bharti Airtel
Neutral
300
-
120,062
105,086
114,808
34.5
34.7
12.2
16.4
24.6
18.3
1.7
1.6
6.8
8.4
2.1
1.8
Idea Cellular
Neutral
73
-
26,178
40,133
43,731
37.2
37.1
6.4
6.5
11.4
11.2
1.0
0.9
8.2
7.6
1.7
1.4
zOthers
Abbott India
Neutral
4,761
-
10,116
3,153
3,583
14.1
14.4
152.2
182.7
31.3
26.1
153.6
131.2
25.6
26.1
2.9
2.5
Bajaj Electricals
Buy
218
274
2,203
4,801
5,351
5.7
6.2
10.4
13.7
20.9
15.9
2.6
2.3
12.4
14.5
0.5
0.4
Finolex Cables
Neutral
390
-
5,960
2,883
3,115
12.0
12.1
14.2
18.6
27.4
21.0
14.6
12.8
15.8
14.6
1.8
1.6
Goodyear India*
Neutral
701
-
1,617
1,598
1,704
10.4
10.2
49.4
52.6
14.2
13.3
65.5
57.5
18.2
17.0
0.7
96.5
Hitachi
Neutral
1,356
-
3,687
2,081
2,433
8.8
8.9
33.4
39.9
40.6
34.0
32.8
27.3
22.1
21.4
1.8
1.5
Jyothy Laboratories
Neutral
339
-
6,151
1,440
2,052
11.5
13.0
8.5
10.0
39.9
33.9
9.7
8.9
18.6
19.3
4.6
3.2
Page Industries
Neutral
12,751
-
14,223
2,450
3,124
20.1
17.6
299.0
310.0
42.7
41.1
284.0
216.8
47.1
87.5
5.9
4.6
Relaxo Footwears
Neutral
396
-
4,751
2,085
2,469
9.2
8.2
7.6
8.0
52.4
49.8
20.3
17.3
17.9
18.8
2.4
2.0
Siyaram Silk Mills
Accumulate
1,187
1,714
1,113
1,799
2,040
11.6
11.7
104.9
122.4
11.3
9.7
1.9
1.6
16.4
16.4
0.8
0.7
Styrolution ABS India*
Neutral
587
-
1,032
1,440
1,537
9.2
9.0
40.6
42.6
14.5
13.8
36.9
33.6
12.3
11.6
0.7
0.6
TVS Srichakra
Neutral
3,241
-
2,481
2,304
2,614
13.7
13.8
231.1
266.6
14.0
12.2
364.1
286.7
33.9
29.3
1.1
0.9
HSIL
Neutral
303
-
2,191
2,384
2,515
15.8
16.3
15.3
19.4
19.8
15.6
19.7
16.9
7.8
9.3
1.1
1.0
Kirloskar Engines India
Neutral
318
-
4,599
2,554
2,800
9.9
10.0
10.5
12.1
30.3
26.3
12.7
12.0
10.7
11.7
1.4
1.3
Ltd
M M Forgings
Neutral
425
-
513
546
608
20.4
20.7
41.3
48.7
10.3
8.7
58.2
51.5
16.6
17.0
0.8
0.7
Banco Products (India)
Neutral
176
-
1,256
1,353
1,471
12.3
12.4
14.5
16.3
12.1
10.8
16.7
15.1
14.5
14.6
0.9
92.7
Competent Automobiles Neutral
152
-
94
1,137
1,256
3.1
2.7
28.0
23.6
5.4
6.5
29.3
26.5
14.3
11.5
0.1
0.1
Stock Watch
November 24, 2016
Company Name
Reco
CMP
Target
Mkt Cap
Sales ( Čcr )
OPM(%)
EPS (Č)
PER(x)
P/BV(x)
RoE(%)
EV/Sales(x)
(Č)
Price ( Č)
( Č cr )
FY17E
FY18E
FY17E
FY18E
FY17E
FY18E
FY17E
FY18E
FY17E
FY18E
FY17E
FY18E
FY17E
FY18E
zOthers
Nilkamal
Neutral
1,283
-
1,915
1,995
2,165
10.7
10.4
69.8
80.6
18.4
15.9
73.3
63.7
16.6
16.5
1.0
0.8
Visaka Industries
Neutral
190
-
302
1,051
1,138
10.3
10.4
21.0
23.1
9.1
8.2
24.4
22.8
9.0
9.2
0.5
0.5
Transport Corporation of
Neutral
169
-
1,294
2,671
2,911
8.5
8.8
13.9
15.7
12.2
10.8
1.7
1.5
13.7
13.8
0.6
0.5
India
Elecon Engineering
Neutral
47
-
514
1,482
1,660
13.7
14.5
3.9
5.8
12.1
8.1
2.8
2.6
7.8
10.9
0.7
0.6
Surya Roshni
Neutral
194
-
850
3,342
3,625
7.8
7.5
17.3
19.8
11.2
9.8
21.3
17.1
10.5
10.8
0.5
0.5
MT Educare
Neutral
113
-
450
366
417
17.7
18.2
9.4
10.8
12.1
10.5
2.7
2.3
22.2
22.3
1.1
1.0
Radico Khaitan
Buy
120
147
1,595
1,667
1,824
13.0
13.2
6.7
8.2
18.0
14.6
1.6
1.5
9.0
10.2
1.3
1.2
Garware Wall Ropes
Neutral
593
-
1,298
873
938
14.3
14.3
35.2
37.5
16.9
15.8
3.0
2.5
17.5
15.9
1.4
1.3
Wonderla Holidays
Neutral
325
-
1,836
287
355
38.0
40.0
11.3
14.2
28.8
22.9
4.1
3.6
21.4
23.9
6.1
4.9
Linc Pen & Plastics
Neutral
230
-
340
382
420
9.3
9.5
13.5
15.7
17.1
14.6
2.9
2.5
17.1
17.3
1.0
0.9
The Byke Hospitality
Neutral
177
-
709
287
384
20.5
20.5
7.6
10.7
23.3
16.5
4.9
3.9
20.7
23.5
2.5
1.9
Interglobe Aviation
Neutral
870
-
31,333
21,122
26,005
14.5
27.6
110.7
132.1
7.9
6.6
47.0
33.6
168.5
201.1
1.5
1.1
Coffee Day Enterprises
Neutral
201
-
4,133
2,964
3,260
20.5
21.2
4.7
8.0
-
25.1
2.3
2.1
5.5
8.5
1.8
1.6
Ltd
Navneet Education
Neutral
108
-
2,577
1,062
1,147
24.0
24.0
6.1
6.6
17.8
16.3
3.7
3.2
20.6
19.8
2.5
2.3
Navkar Corporation
Buy
176
265
2,510
408
612
42.9
42.3
6.8
11.5
26.0
15.3
1.8
1.6
6.9
10.5
7.1
4.7
UFO Moviez
Neutral
425
-
1,172
619
685
33.2
33.4
30.0
34.9
14.2
12.2
2.0
1.7
13.8
13.9
1.6
1.3
VRL Logistics
Neutral
262
-
2,391
1,902
2,119
16.7
16.6
14.6
16.8
18.0
15.6
3.9
3.5
21.9
22.2
1.4
1.2
Team Lease Serv.
Neutral
843
-
1,441
3,229
4,001
1.5
1.8
22.8
32.8
37.0
25.7
4.0
3.4
10.7
13.4
0.3
0.3
S H Kelkar & Co.
Neutral
290
-
4,194
1,036
1,160
15.1
15.0
6.1
7.2
47.5
40.4
5.1
4.7
10.7
11.5
3.9
3.5
Quick Heal
Neutral
232
-
1,627
408
495
27.3
27.0
7.7
8.8
30.0
26.4
2.8
2.8
9.3
10.6
3.1
2.6
Narayana Hrudaya
Neutral
349
-
7,130
1,873
2,166
11.5
11.7
2.6
4.0
131.9
88.0
8.1
7.3
6.1
8.3
3.9
3.4
Manpasand Bever.
Neutral
620
-
3,546
836
1,087
19.6
19.4
16.9
23.8
36.7
26.0
4.4
3.8
12.0
14.8
4.0
3.0
Parag Milk Foods
Neutral
264
-
2,220
1,919
2,231
9.3
9.6
9.5
12.9
27.9
20.4
4.3
3.6
15.5
17.5
1.3
1.1
Mirza International
Buy
70
107
845
987
1,106
18.0
18.0
6.5
7.6
10.8
9.2
1.7
1.5
15.9
15.7
1.1
0.9
Asian Granito
Buy
187
351
561
1,071
1,182
12.1
12.4
12.7
16.0
14.7
11.7
1.4
1.3
9.5
10.7
0.8
0.7
Source: Company, Angel Research; Note: *December year end; #September year end; &October year end; Price as on November 23, 2016
Market Outlook
November 24, 2016
Research Team Tel: 022 - 39357800
DISCLAIMER
Angel Broking Private Limited (hereinafter referred to as “Angel”) is a registered Member of National Stock Exchange of India
Limited,Bombay Stock Exchange Limited and Metropolitan Stock Exchange Limited. It is also registered as a Depository Participant with
CDSL and Portfolio Manager with SEBI. It also has registration with AMFI as a Mutual Fund Distributor. Angel Broking Private Limited is a
registered entity with SEBI for Research Analyst in terms of SEBI (Research Analyst) Regulations, 2014 vide registration number
INH000000164. Angel or its associates has not been debarred/ suspended by SEBI or any other regulatory authority for accessing
/dealing in securities Market. Angel or its associates/analyst has not received any compensation / managed or
co-managed public offering of securities of the company covered by Analyst during the past twelve months.
This document is solely for the personal information of the recipient, and must not be singularly used as the basis of any investment
decision. Nothing in this document should be construed as investment or financial advice. Each recipient of this document should make
such investigations as they deem necessary to arrive at an independent evaluation of an investment in the securities of the companies
referred to in this document (including the merits and risks involved), and should consult their own advisors to determine the merits and
risks of such an investment.
Reports based on technical and derivative analysis center on studying charts of a stock's price movement, outstanding positions and
trading volume, as opposed to focusing on a company's fundamentals and, as such, may not match with a report on a company's
fundamentals. Investors are advised to refer the Fundamental and Technical Research Reports available on our website to evaluate the
contrary view, if any.
The information in this document has been printed on the basis of publicly available information, internal data and other reliable
sources believed to be true, but we do not represent that it is accurate or complete and it should not be relied on as such, as this
document is for general guidance only. Angel Broking Pvt. Limited or any of its affiliates/ group companies shall not be in any way
responsible for any loss or damage that may arise to any person from any inadvertent error in the information contained in this report.
Angel Broking Pvt. Limited has not independently verified all the information contained within this document. Accordingly, we cannot
testify, nor make any representation or warranty, express or implied, to the accuracy, contents or data contained within this document.
While Angel Broking Pvt. Limited endeavors to update on a reasonable basis the information discussed in this material, there may be
regulatory, compliance, or other reasons that prevent us from doing so.
This document is being supplied to you solely for your information, and its contents, information or data may not be reproduced,
redistributed or passed on, directly or indirectly.
Neither Angel Broking Pvt. Limited, nor its directors, employees or affiliates shall be liable for any loss or damage that may arise from
or in connection with the use of this information.